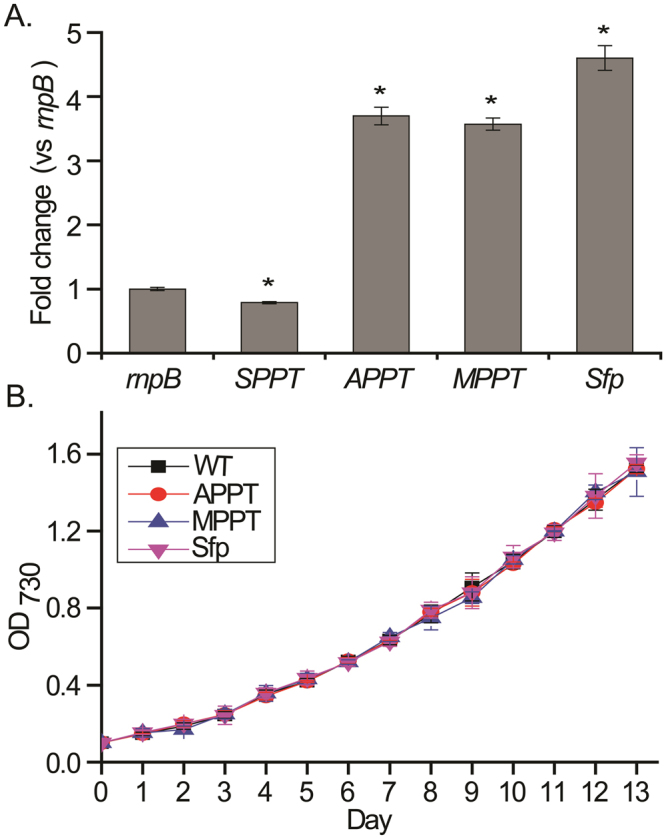
Figure 4.

The in vivo activity of APPT, MPPT and Sfp in Synechocystis mutants. (A) Quantitative analysis of transcriptional levels of SPPT, APPT, MPPT and Sfp genes. The signals were normalized with that of rnpB gene from each mutant and wild type. The asterisk (*) indicated statistical significance differences (P < 0.05). The error bars represented the standard deviations of triplicate assays. (B) Growth curve of Synechocystis wild type and mutants. OD730 was continuously monitored for 13 days. The error bars represented the standard deviations of triplicate measurements.
