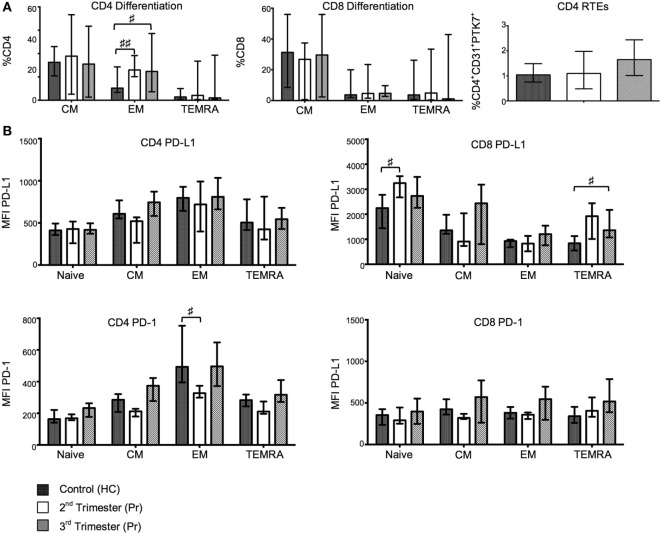
Figure 2.
Changes in T-cell maturation and exhaustion with normal pregnancy. (A) Shows the frequencies of naïve, EM, CM, and TEMRA CD4 and CD8 T cells as determined by flow cytometry in pregnant (Pr) and health control (HC). Additionally, we show proportions of CD4 recent thymic emigrants determined by CD31 and PTK7 coexpression. (B) Programmed death-1 (PD-1) and PD ligand 1 (PD-L1) expression measured by mean florescence intensity (MFI) on naïve, EM, CM, and TEMRA CD4 and CD8 T cells. Columns indicate median and error bars interquartile range. ♯p < 0.05 and ♯♯p < 0.01 (Kruskal–Wallis one way analysis of variance and Dunn’s test for multiple comparisons).

