
Figure 3.
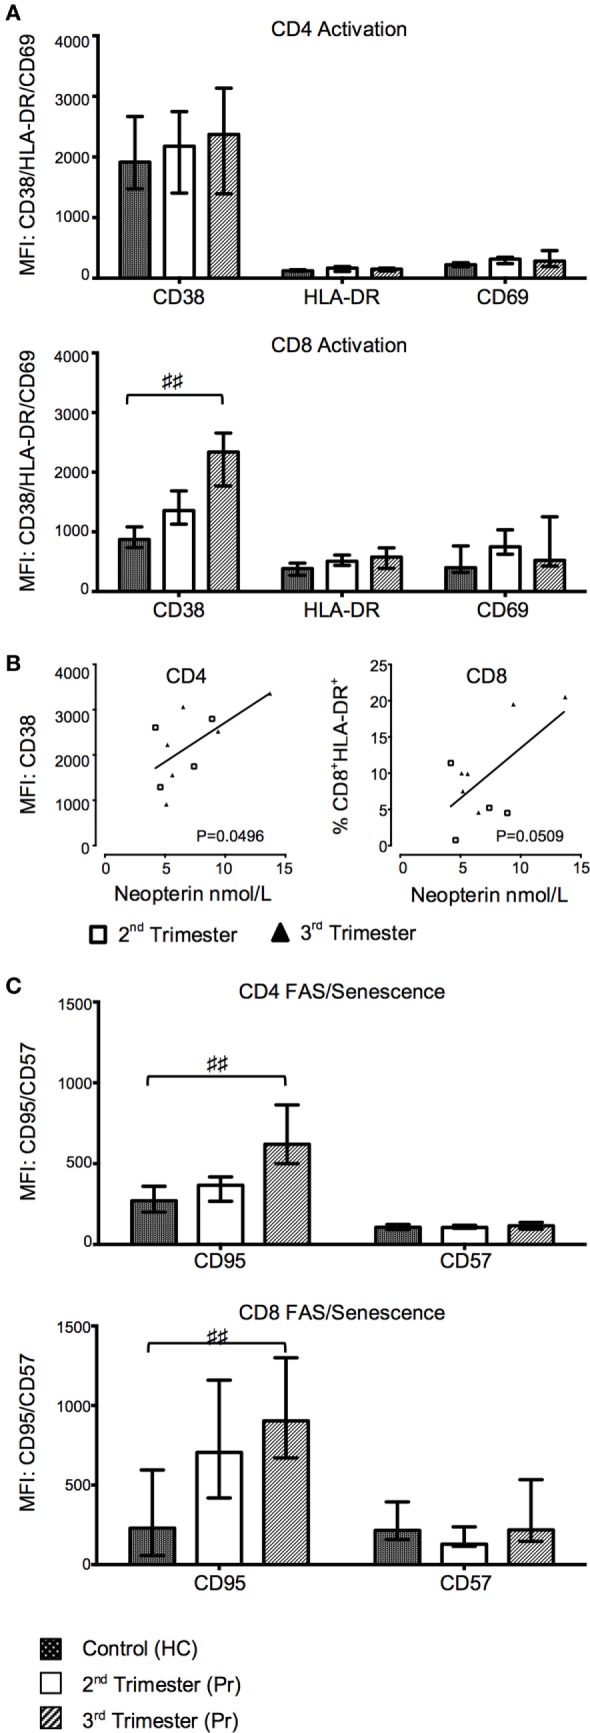
Gradual increase in T cell activation and pro-apoptotic marker expression during normal pregnancy. (A) Changes in activation markers CD38, HLA-DR, and CD69 expression in CD4 and CD8 T cells with trimesters and compared to controls. (B) Plasma neopterin concentration in pregnancy correlated with CD38 mean florescence intensity (MFI) on CD4+ T cells. (C) FAS and CD57 marker expression on CD4 and CD8 T cells during pregnancy and compared to health controls (HCs). Columns indicate median and error bars interquartile range. ♯♯p < 0.01 (Kruskal–Wallis one way analysis of variance and Dunn’s test for multiple comparisons). Abbreviation: Pr, pregnant.