
Fig. 3.
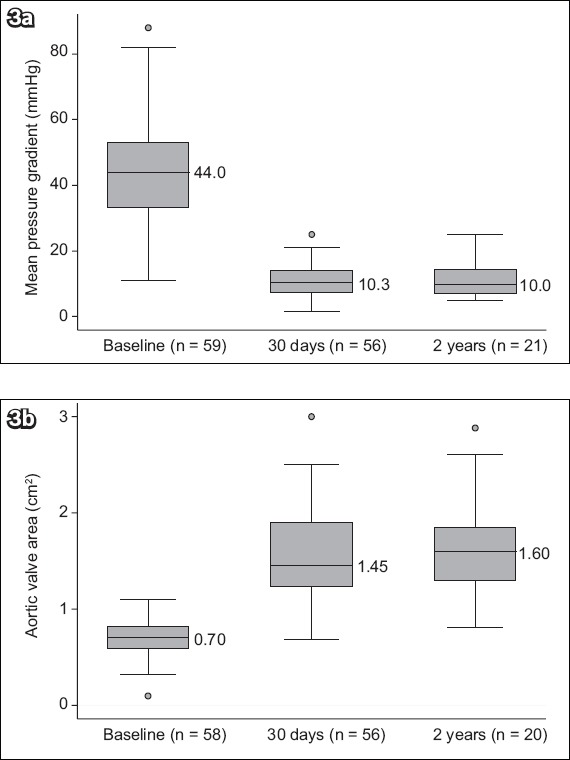
Graphs show the echocardiographic data of all patients: (a) mean pressure gradient at baseline, 30 days and two years; and (b) aortic valve area at baseline, 30 days and two years.
Official websites use .gov
A
.gov website belongs to an official
government organization in the United States.
Secure .gov websites use HTTPS
A lock (
) or https:// means you've safely
connected to the .gov website. Share sensitive
information only on official, secure websites.
Graphs show the echocardiographic data of all patients: (a) mean pressure gradient at baseline, 30 days and two years; and (b) aortic valve area at baseline, 30 days and two years.