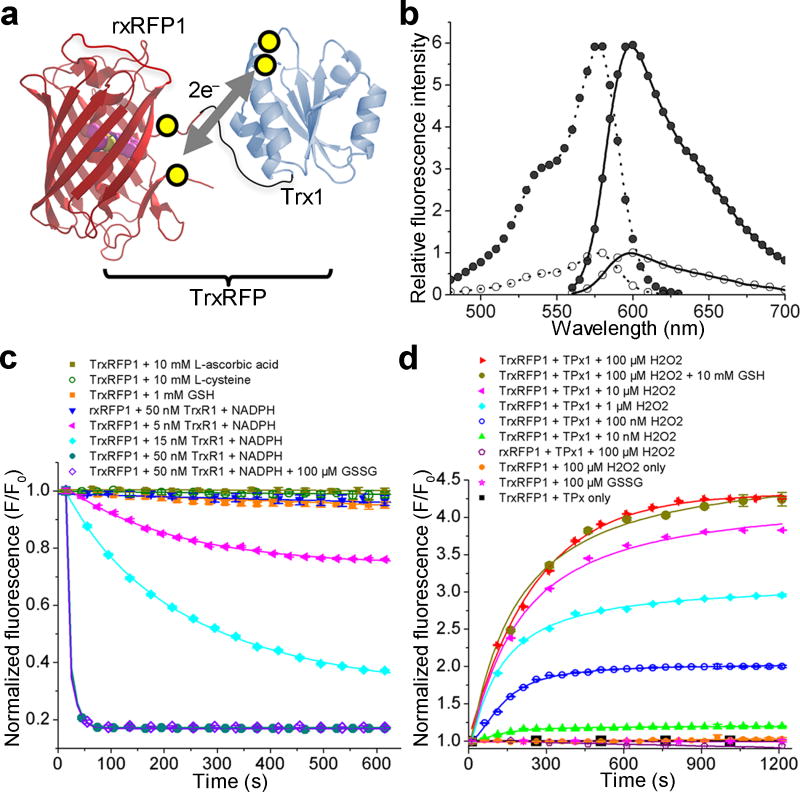
Figure 1. Design and fluorescence characterization of TrxRFP biosensors.
(a) Schematic representation of the mechanism for TrxRFP sensors. The yellow circles indicate cysteine residues involved in the redox coupling. (b) Excitation (dotted line) and emission (solid line) spectra of reduced (open circle) and oxidized (filled circle) TrxRFP1. Spectra were normalized to the maximal fluorescence of the reduced form. (c) Kinetic traces for the reduction of oxidized proteins. (d) Kinetic traces for the oxidation of reduced proteins. TrxR1 used in these experiments was a commercial rat TrxR1 containing ~ 50% of the full-length selenocysteine (Sec)-containing enzyme.

