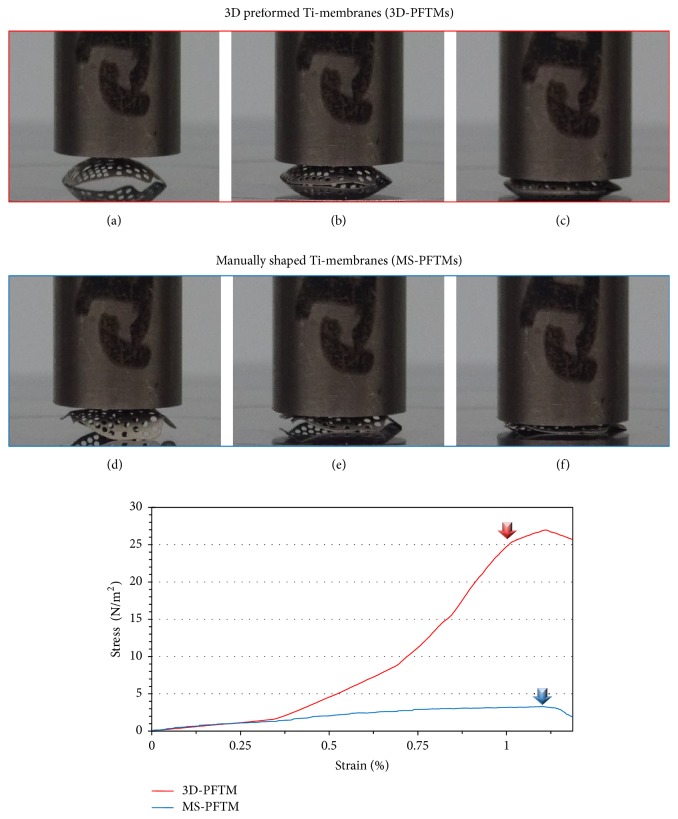
Figure 5.
Deformation photographs and stress-strain graphs after static compressive load test. In the 3D-PFTM group, (a) initial state, (b) compressive loading, and (c) primary plastic deformation occurred. In the MS-PFTM group, (d) initial state, (e) compressive loading, and (f) primary plastic deformation occurred. The red (3D-PFTM) and blue (MS-PFTM) arrows in the graph indicated the load at the primary plastic deformation.

