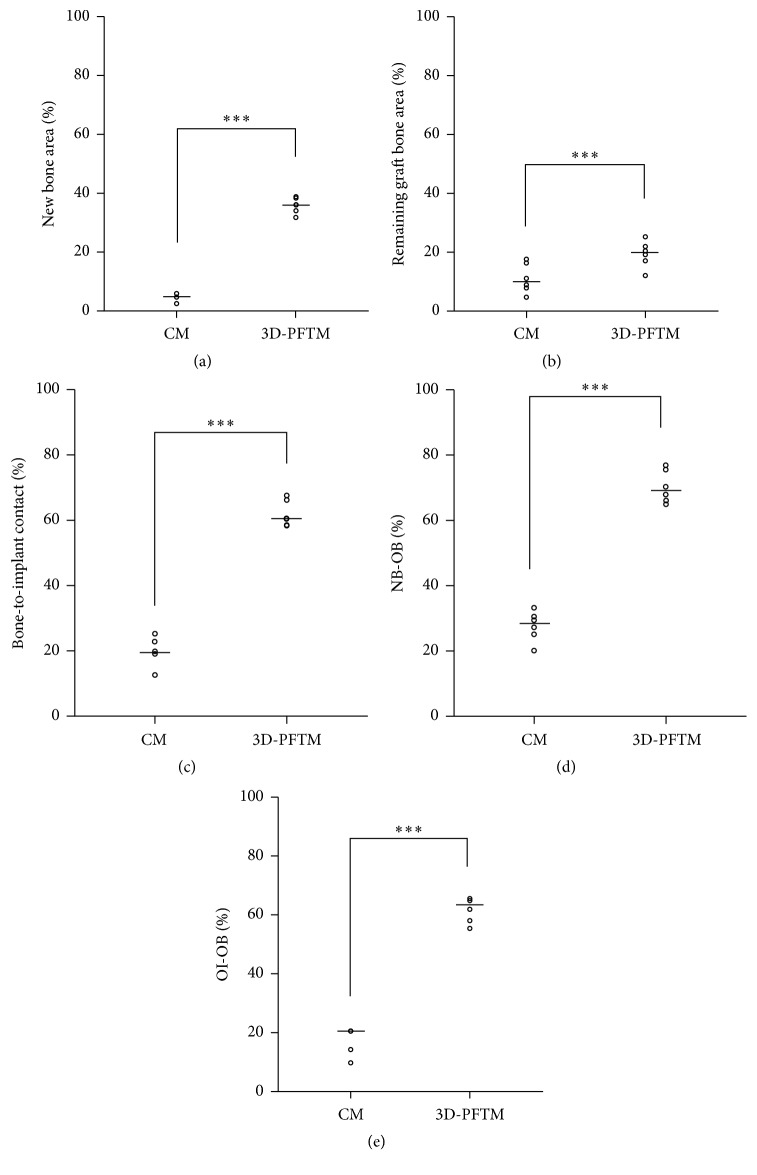
Figure 9.
Scatter plot and median (the cross) representing graph of the control group (CM) and experimental group (3D-PFTM): (a) the area of newly formed bone tissues (NBA), (b) the remaining area covered by the bone graft substitutes (RBA), (c) bone-to-implant contact within the defect (BIC), (d) distance from the new bone to the old bone (NB-OB), and (e) distance from the osseointegration to the old bone (OI-OB) (n = 6). ∗∗∗Significantly different (p < .001).

