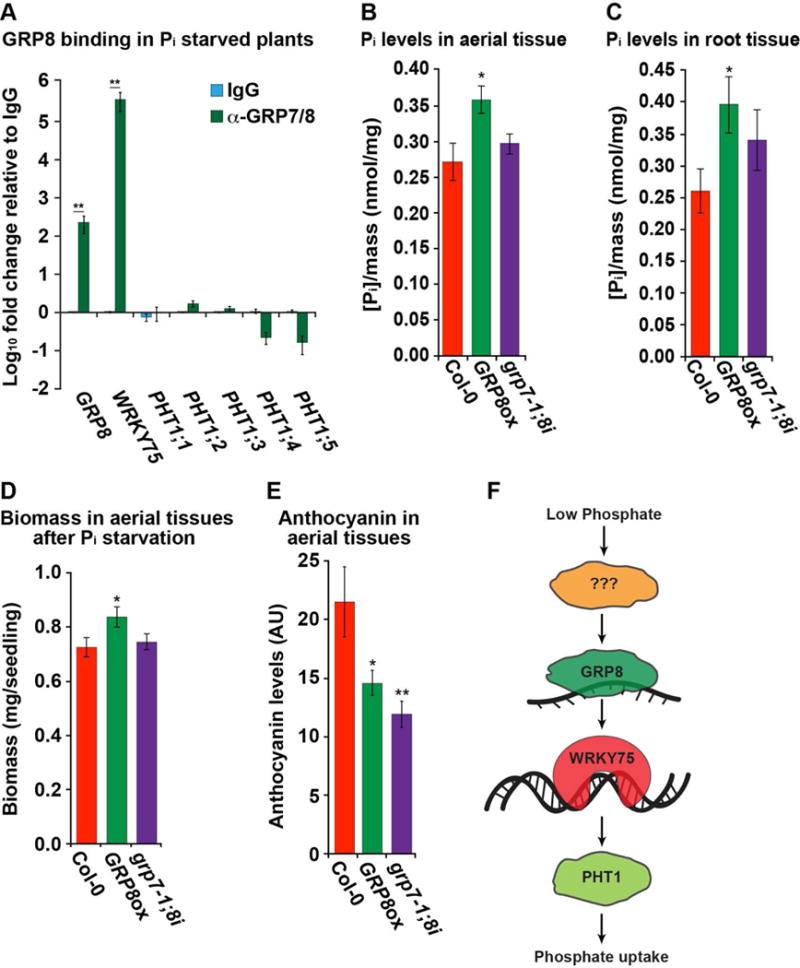
Figure 7. GRP8 alleviates phosphate deprivation stress.

(A) RIP-qPCR of root tissue from grp7-1 plants grown under phosphate starvation. RIP-qPCR was performed with a rabbit IgG (blue) or rabbit serum raised against GRP7 and GRP8 (green) graphed as fold change relative to α-IgG, n = 4 (B–C) Measurement of phosphate levels normalized to mass after 3-days of phosphate starvation in the shoots (B) or roots (C) of 8-day-old seedlings, n = 12. (D–E) Biomass (D) or anthocyanin levels (E) for 18-day-old seedlings after 2 weeks of phosphate deprivation, n = 12. For (A)-(E), *, **, and *** denote p value < 0.05, 0.01, and 0.001, respectively, Welch’s t-test. Error bars indicate SEM. (F) A model of the role of GRP8 on the plant phosphate starvation response. See also Figures S1, S2, S4, S6–S7.
