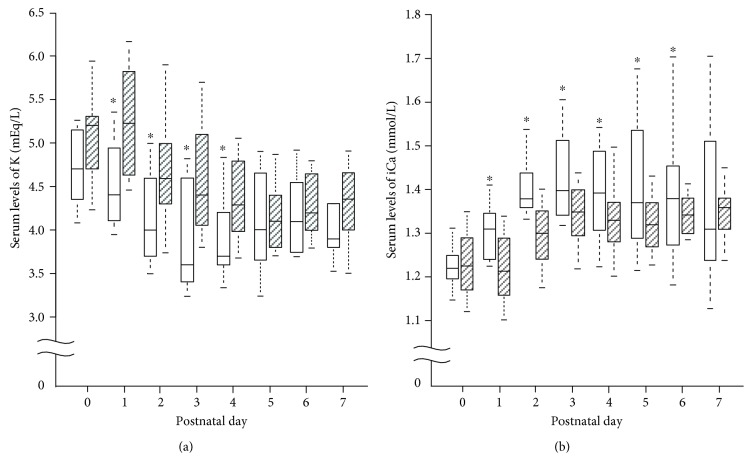
Figure 2.
Changes in serum levels of potassium (K, panel (a)) and ionized calcium (iCa, panel (b)) during the first week of life in very low birth weight infants. The box plots are given separately for the hypophosphatemia group (open bars) and the normophosphatemia group (hatched bars). ∗p < 0.05. (Hypophosphatemia group versus normophosphatemia group on each postnatal day.)

