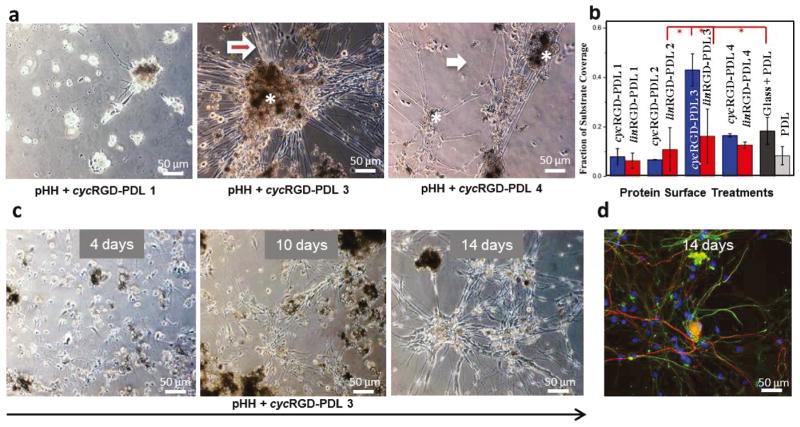
Figure 2. Attributes of RGD-Modified PDL Surface Treatment Showing DRG Cell Culture Optimal Temporal Progression and Glia-Neurons Association.
(a) Phase contrast inverted microscope images of DRG cells on different surface treatments after ~9 days in culture. Cell bodies range orange-dark brown. White asterisks mark cell clusters. The white arrows point to individual cell terminals, while the red asterisks mark bundles of terminals, more frequently extending out of cell clusters. (b) Surface area coverage of DRG cells as a response to cyc (blue bars) and lin (red bars) RGD-PDL surface treatments after ~9 days in culture. Tukey’s mean comparisons are presented in Supplementary Information, Table S2. Key differences are highlighted by red asterisks, p < 0.0001. (c) DRG cell culture development over time on pHEMA spin-coated glass slides treated with cycRGD-PDL 3. (d) Confocal fluorescence micrograph of (c) showing the different types of cells: neurons (red) and glia (green). Cell nuclei are blue.

