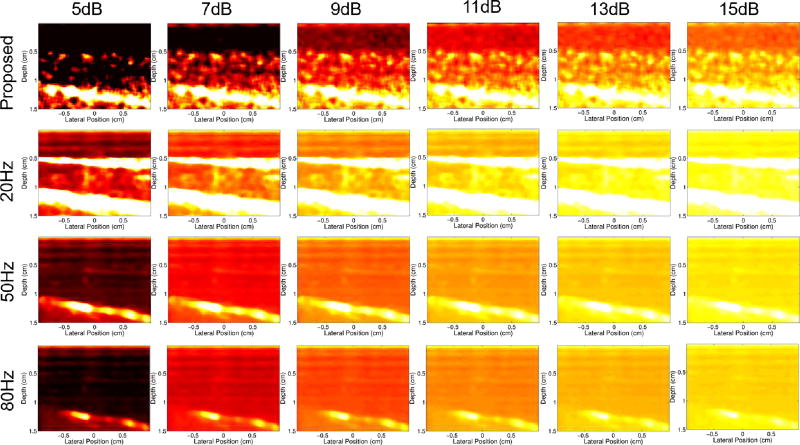
Fig. 10.
Power Doppler images made from the 22s time point of the occlusion scan for the proposed filter (first row) and conventional filter with 20Hz (second row), 50Hz (third row), and 80Hz (bottom row) filter cutoffs. Dynamic ranges between 5 and 15dB are compared. The maximum in all images is 3dB.

