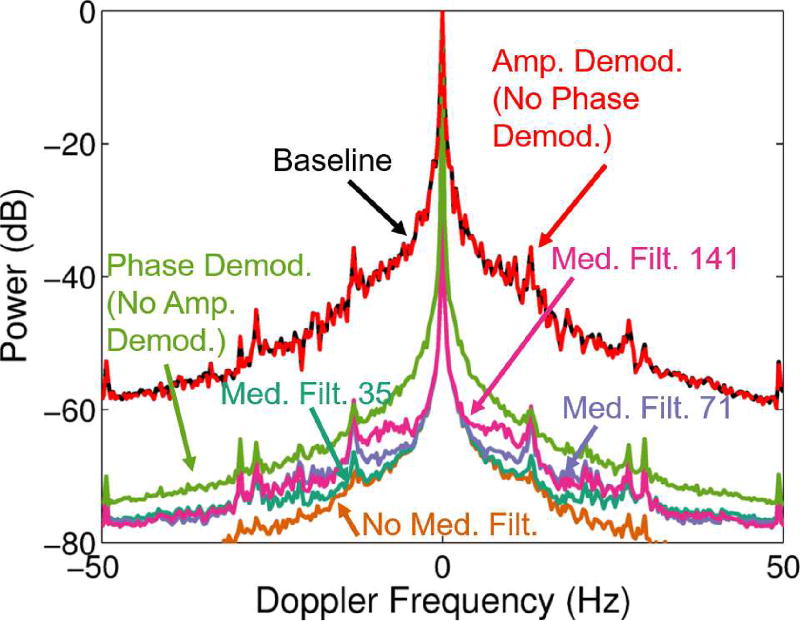
Fig. 4.
Average spectra through depth across subjects are shown for the data acquired with the L12-5 probe and SPW acquisition method (7.8MHz imaging frequency, imaging case 2) for different steps of the adaptive demodulation scheme. The frequency axis is cropped to highlight differences at −60dB. Spectra are shown for baseline (black), after amplitude demodulation (red), after phase demodulation (green), and after phase & amplitude demodulation with median filter sizes of 141 (pink), 71 (purple), 35 (teal), and no median filter (orange).

