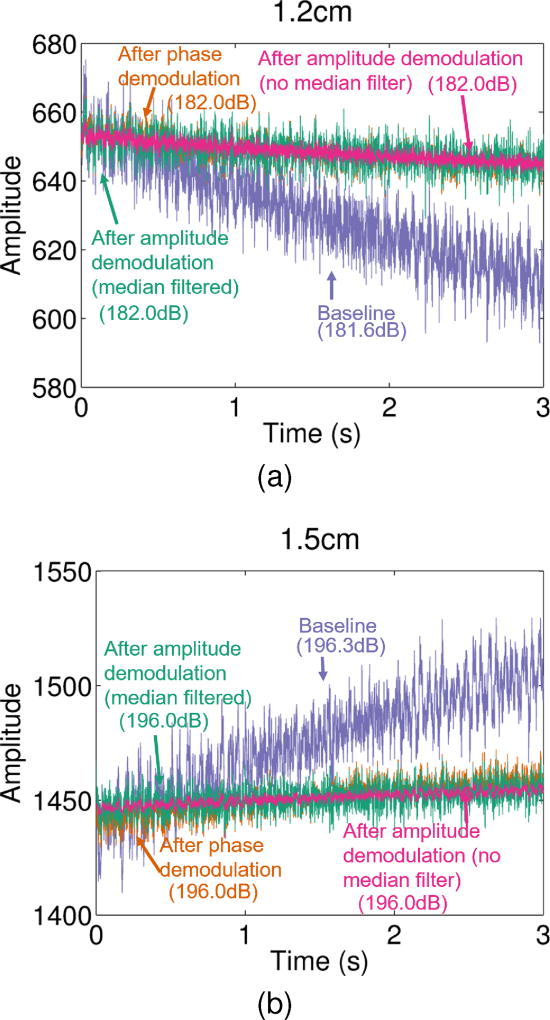
Fig. 5.
Amplitude through slow-time is shown for two example depths. For each depth, amplitude is shown for the raw RF data (purple), phase demodulated RF data (orange), and phase & amplitude demodulated RF data with (teal) and without (pink) median filtering. Individual power estimates in dB for each line are shown next to corresponding labels.

