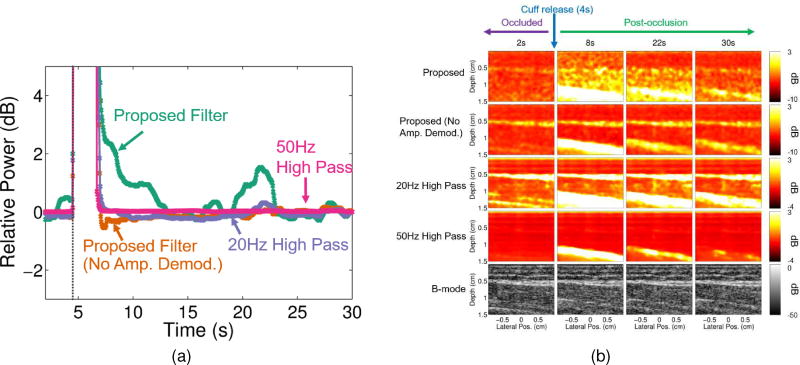
Fig. 6.
(a) Median relative power with respect to the last in vivo arterial occlusion time point (for each filtering method) is plotted for every 50ms for each filtering case: proposed filter (teal), proposed filter with no amplitude demodulation (orange), 20Hz high pass (purple), and 50Hz high pass (pink). The time point at which the cuff was released is marked by the dark gray vertical dotted line (at about 4s). (b) Power Doppler and corresponding B-mode images (bottom row) are shown for 2, 8, 22, and 30 second time points of the in vivo arterial occlusion scan for each filtering case: proposed filter (first row), proposed filter with no amplitude demodulation (second row), 20Hz high pass (third row), and 50Hz high pass (fourth row).

