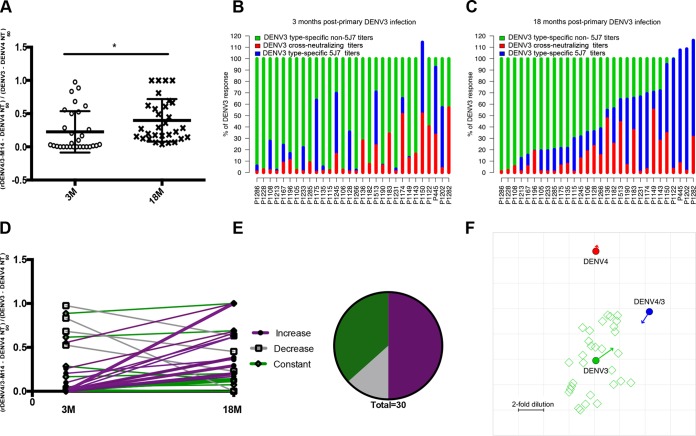
FIG 3 .
Proportion and kinetics of the DENV3 type-specific neutralizing antibody response attributable to the 5J7 epitope. (A) The proportion of the DENV3 type-specific response directed to the 5J7 epitope obtained with 3- and 18-month post-infection samples. Results for 3 and 18 months (n = 30) were compared by paired t test, where * represents P < 0.05. (B and C) Proportion of the rDENV4/3-M14 and DENV4 neutralizing antibody response relative to DENV3 NT50, where the y axis represents 100% of the DENV3 NT50 values at 3 and 18 months post-infection, respectively. Individual codes are ordered by the proportion of DENV3 attributable to rDENV4/3-M14 observed at 18 months. (D) Individual trajectories of the proportion of the DENV3 type-specific response directed to the 5J7 epitope at 3 and 18 months (n = 30). (E) Pie chart representing the percentage of individuals who displayed a constant, decreased, or increased proportion of the rDENV4/3-M14 DENV3 response between 3 and 18 months post-primary DENV3 infection (n = 30). (F) Antigenic cartography map generated from NT50. The antigenic cartography map positions viruses (closed circles [rDENV4/3-M14, DENV3, and DENV4]) and plasma (open squares) as points, with the distance between each virus and plasma derived from its respective neutralization titer (see Materials and Methods). Each grid square corresponds to a 2-fold dilution in the neutralization titer. Each open square represents one of the 30 plasma samples analyzed.

