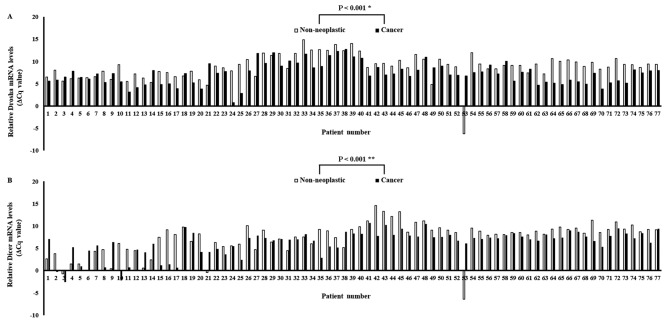
Figure 1.
Relative Drosha and Dicer mRNA expression levels in tumor specimens. (A) Relative Drosha mRNA level (normalized to the corresponding β-actin mRNA) in tumor tissues compared with adjacent non-cancerous colorectal tissues. (B) Relative Dicer mRNA level (normalized to the corresponding β-actin mRNA) in tumor tissues compared with adjacent non-cancerous colorectal tissues. */**P-values were calculated using the Wilcoxon's signed rank test.

