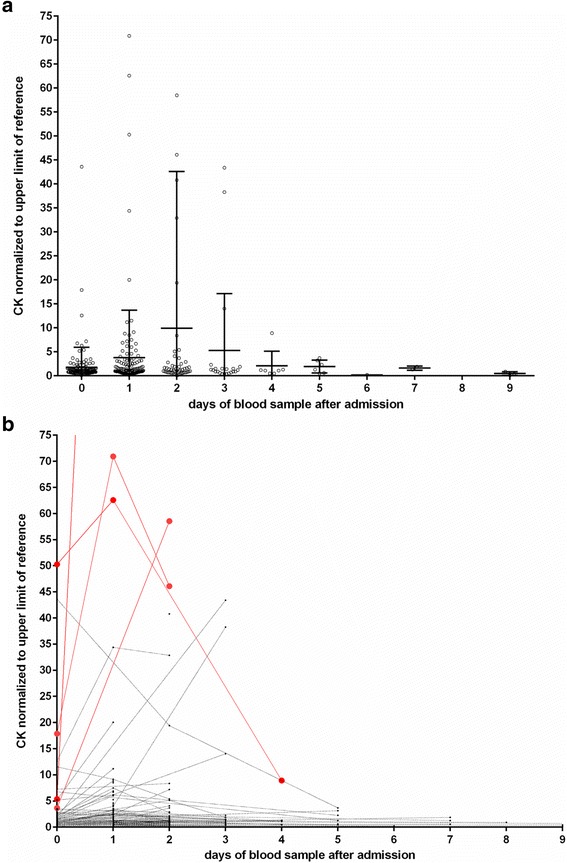
Fig. 3.

Time course of CK measurements for individual patients (a). An outlier with a CK 350 times above the upper limit of normal was clipped from the figure. The patients with severe rhabdomyolysis are labeled in red. Time course of CK measurements in the week after the emergency admissions (b). Wide bar: mean. Error bars: standard deviation. The actual measurements are normalized to sex- specific upper limits of the reference range
