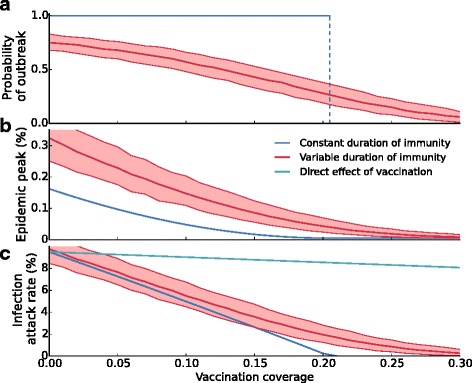
Fig. 3.

Infection attack rates and epidemic peaks are increased in models with variable duration of immunity. Shown are (a) the yearly probability that an epidemic will occur, (b) the peak prevalence in an epidemic, and (c) the infection attack rate, all as a function of the vaccination coverage. The figures show these quantities with constant (blue lines) and variable duration of immunity (red lines). Notice that if the duration of immunity is variable, the infection attack rate and the epidemic peak are always higher than if the duration of immunity is constant. Also notice that the difference between the infection attack rates in both scenarios is most pronounced at a vaccination coverage around the outbreak threshold (approximately at a vaccination coverage of 21%). The red line and the shaded area indicate the median and the 2.5-97.5 percentiles of 1,000 simulations, respectively. Each simulation lasts 150 years. Mean values are calculated over the last 100 years
