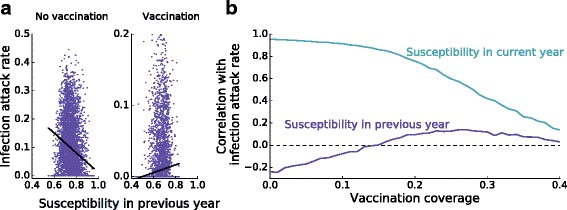
Fig. 4.

Correlations between the infection attack rate and susceptibility in the current and previous year. (a) The Pearson correlation between the number of susceptible individuals at the start of one influenza season and the infection attack rate in the next influenza season is negative without vaccination (; p < 0.00001), as a high susceptibility in one year implies a high probability of an epidemic in that year, and a low probability in the next year. At higher vaccination coverage, however, the accumulation of susceptible persons over multiple years becomes more important, and the correlation between susceptibility in one year and the infection attack rate in the next year is reversed (; p < 0.00001). The switch in correlation from negative to positive is seen in (b) as a function of vaccination coverage (blue line). The correlation between the number of susceptible individuals at the start of the influenza season and the infection attack rate in the same year is positive, with correlations decreasing with increasing vaccination coverage (cyan line). Parameters are as in Fig. 3; in the right panel of (a) a vaccination coverage of 25% is used. For each vaccination coverage, we analyze time series of 10,000 years
