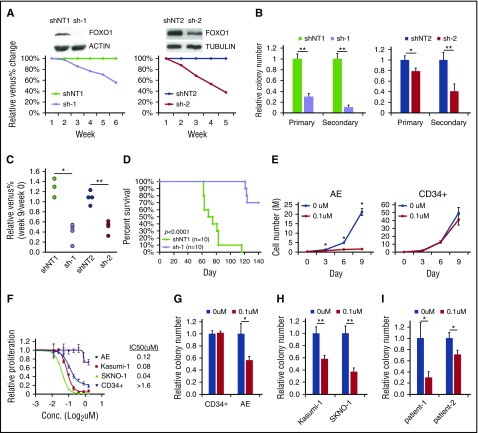
Figure 3.
FOXO1 inhibition impairs growth of AE cells. (A) AE cells were transduced with 2 sets of shNT and FOXO1 shRNA (sh-1 and sh-2) vectors that coexpressed Venus. Knockdown efficiency was confirmed by immunoblot. Growth of AE cells in liquid culture was measured as change of percentage of Venus+ cells relative to shNT by flow cytometry. One representative experiment of 3 replicates is shown. (B) Colony-forming unit (CFU) assay of sorted shRNA-transduced AE cells. n = 3; results represent mean ± SD. *P < .05;**P < .01. (C) shRNA-transduced AE cells were transplanted into immunodeficient mice. Venus+ percentage of human engrafted cells in bone marrow was examined 9 weeks later and normalized to those before the transplantation. *P < .005; **P < .001. One representative experiment of 2 replicates is shown. (D) Survival curve of immunodeficient mice received fully transformed AE cells expressing shNT or FOXO1 shRNA. Two independent experiments were included; P value was calculated by log-rank test. (E) CD34+ HSPCs and AE cells were treated with the FOXO1 inhibitor AS1842856 or DMSO; cell numbers were monitored over time. n = 3; results represent mean ± SD. *P < .01, paired 2-tailed Student t test. (F) Proliferation rate of cells treated with FOXO1 inhibitor at indicated concentration for 6 days, which is determined by WST-1 assay. Data are normalized to DMSO control (0 μM) and are shown as mean ± SD (n = 3). The 50% inhibitory concentration values for each type of cells are indicated. CFU assay of CD34+ HSPCs, AE cells (G), t(8;21) cell lines (H), and primary patient cells (I) treated with FOXO1 inhibitor. Data are normalized to DMSO-treated cells (0 μM). n = 3; results represent mean ± SD. *P < .05; **P < .005. All P values were calculated by unpaired 2-tailed Student t test unless noted. Conc., concentration.

