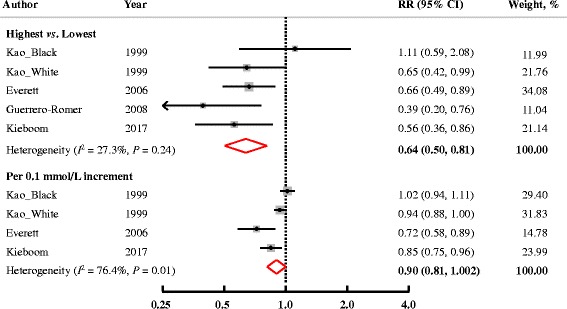
Fig. 4.

Multivariable-adjusted RRs (95% CIs) for incidence of T2DM comparing highest to lowest, or per 0.1 mmol/L increment in serum Mg levels from prospective cohort studies. The summary estimate was obtained by using a random-effects model. The dots indicate the adjusted RRs. The size of the shaded square is proportional to the weight of each study. The horizontal lines represent 95% CIs. The diamond markers indicate the pooled RRs. Abbreviations: CI, confidence interval; RR, relative risk; T2DM, type 2 diabetes mellitus
