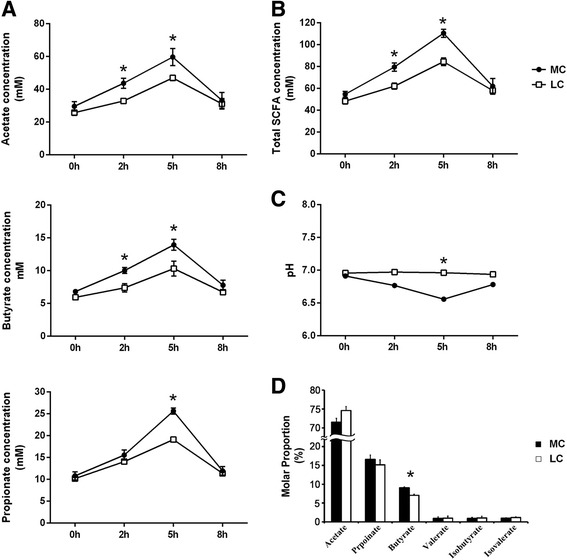
Fig. 1.

a Comparisons of the concentrations of individual SCFAs (acetate, propionate, and butyrate) between the groups. b Comparisons of the concentrations of total SCFA between the groups. c Comparisons of the concentrations of rumen pH between the groups. d Comparisons of the molar proportions of the individual SCFAs between the groups. The molar proportions of the individual SCFAs for ruminal fluid sampled at 8 h after matinal feeding were presented here; 0 h indicates the sampling time just before matinal feeding, and other numbers indicate the sampling time after matinal feeding. Asterisk indicates a p value < 0.05 in the t test
