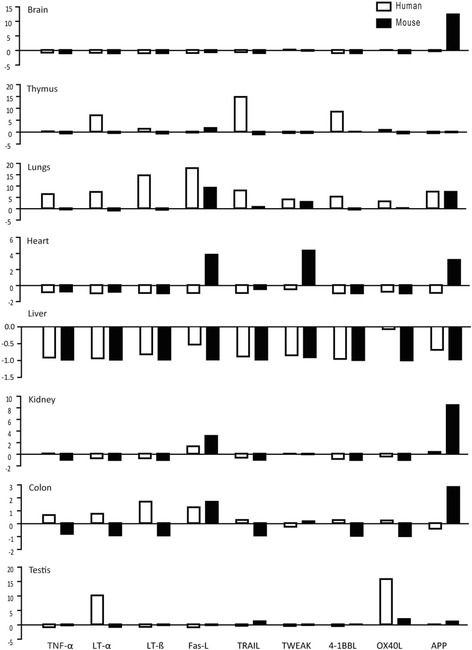
Fig. 2.

Comparison of expression profiles of TNFSF ligands in human and mice. The respective relative human (white bars) and murine (black bars) and TNFSF ligands mRNA expression levels from Fig. 1 are illustrated. The x-axis shows mRNA expression levels of the organs normalized to spleen mRNA expression levels of the respective species. The y-axis marks the fold-change in each direction. Note that the scale of the y-axis is different for each organ. Data represent means ± SEM
