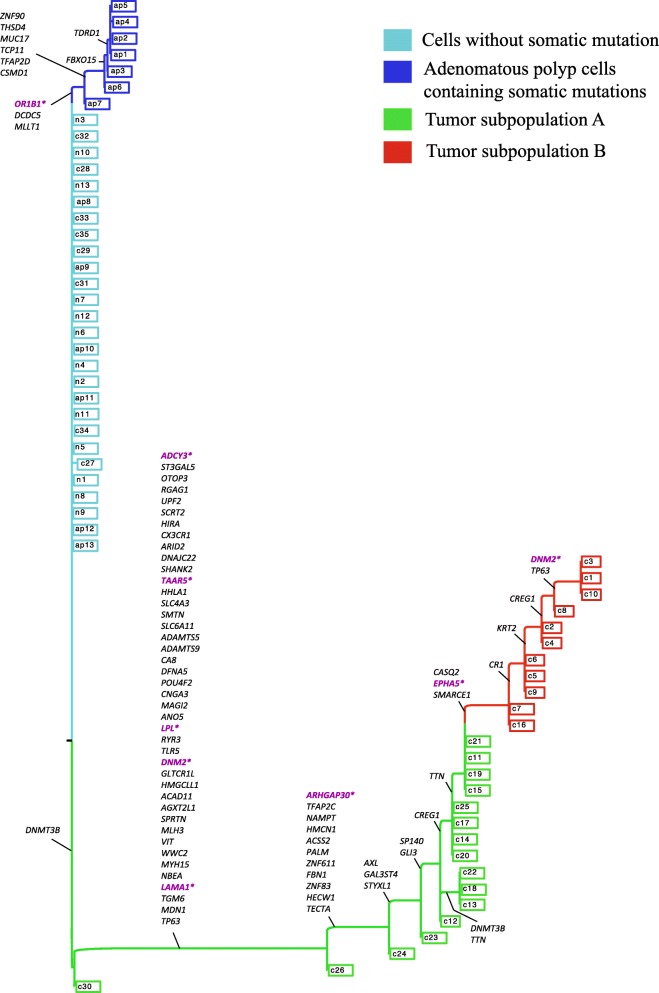
Fig. 5.
Maximum likelihood phylogenetic tree reconstructed by SiFit for adenomatous polyps and colorectal cancer. The leaves with legend marked with “n” are normal cells, leaves marked with “ap” are adenomatous polyp cells, and all other leaves are single tumor cells. Mutations are annotated on the branches of the tree. Important genes reported in the original study are marked in purple

