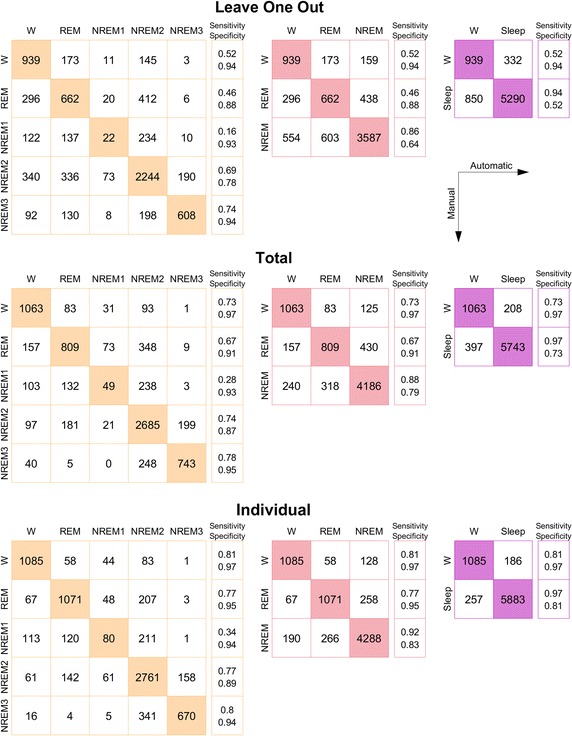
Fig. 6.

Confusion matrices for the three types of cross validation, and three model complexities. Colors match those of Fig. 4. For each matrix is given an extra column of sensitivities and specificities. We direct the reader to Fig. 4, right axis, for average accuracies. As indicated by the legend, rows correspond to manual labels, columns to automatically generated labels
