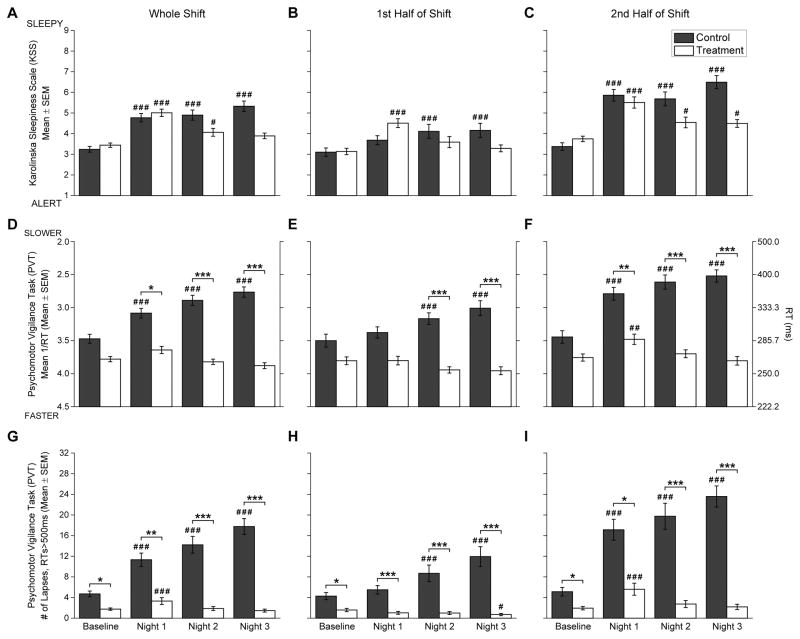
Figure 2.
Subjective sleepiness (upper row, A–C), reaction time (RT) performance (middle row, D–F), and lapses of attention (lower row, G–I) during the work shifts. The left panels (A, D, G) show data from the whole shift, the middle panels (B, E, H) show data from the first half of the shifts, and right panels (C, F, I) show data from the second half of the shifts. Black bars indicate Control Group and white bars indicate Treatment Group. Data presented are mean±SEM. For all measures, Baseline data were averaged over testing sessions on Day shifts 3 and 4. The right y-axis for RT performance (middle row, D–F) indicates the equivalent RT (ms) as a reference for the left y-axis Mean 1/RT values. Number symbols (#) above bars indicate Night shifts that were significantly different versus the day shift Baseline, and asterisk symbols (*) indicate significantly different between Control and Treatment Groups. Level of significance is indicated by the number of symbols: one symbol = p<0.05; two symbols = p<0.01; three symbols = p<0.001.

