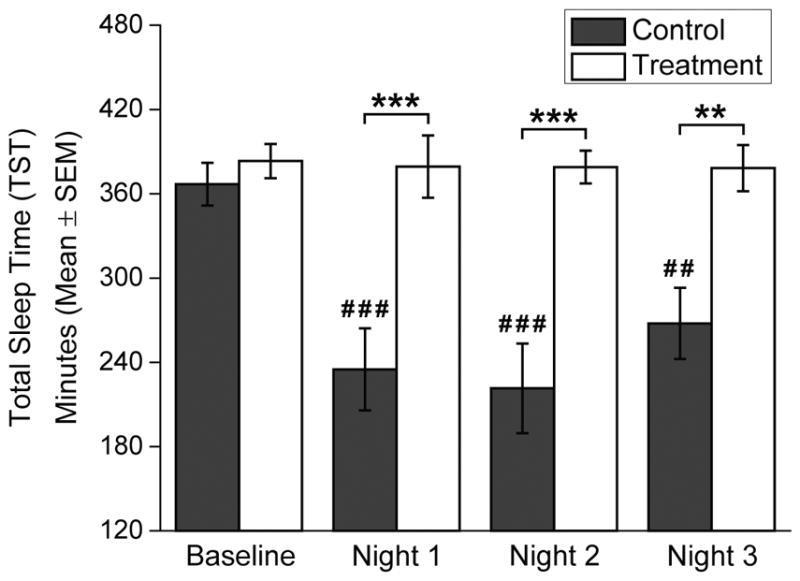
Figure 3.

Total sleep time (TST, mean±SEM) in minutes as determined from wrist actigraphy. Black bars indicate Control Group and white bars indicate Treatment Group. Baseline TST was averaged over the final two scheduled nighttime sleep episodes (those immediately prior to Day shifts 3 and 4), and TST for Nights 1–3 represents the amount of sleep following the respective night shifts. Control Group participants slept ad lib following each night shift, so if participants slept in more than one episode prior to the subsequent night shift the amount of all sleep since the last night shift was summed. Number symbols (#) above bars indicate that TST is significantly different versus the Baseline TST, and asterisk symbols (*) indicate a significant difference in TST between the Control and Treatment Groups. Level of significance is indicated by the number of symbols shown: one symbol = p<0.05; two symbols = p<0.01; three symbols = p<0.001.
