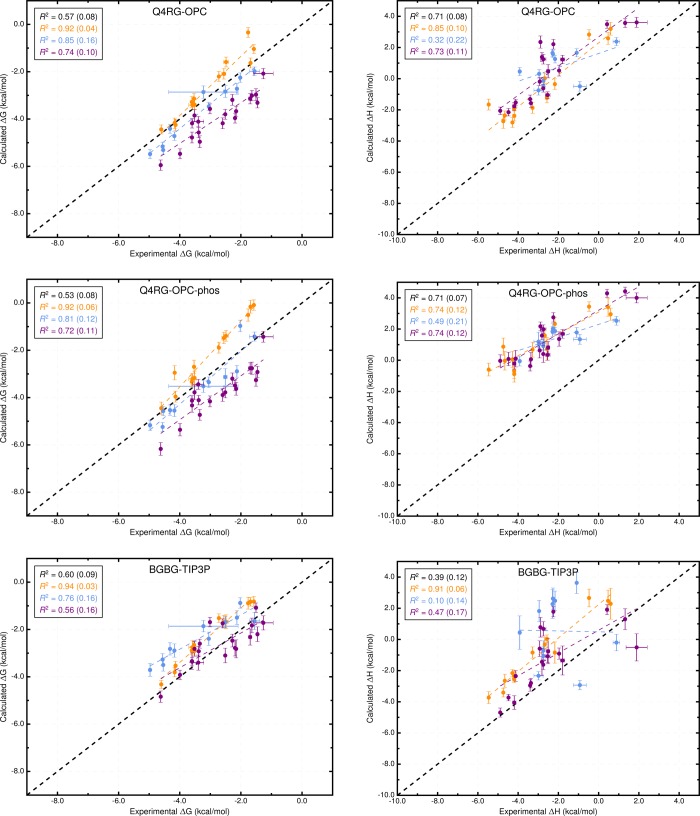
Figure 4.
Comparison of calculated binding free energies and binding enthalpies with experiment: (top row) Q4RG-OPC, (middle row) Q4RG-OPC-phos, and (bottom row) BGBG-TIP3P. The orange, blue, and purple colors distinguish the functional group of the guest as an ammonium, alcohol, or carboxylate, respectively. The overall R2 is indicated in black followed by values for each guest functional group colored as mentioned previously.

