
Figure 1.
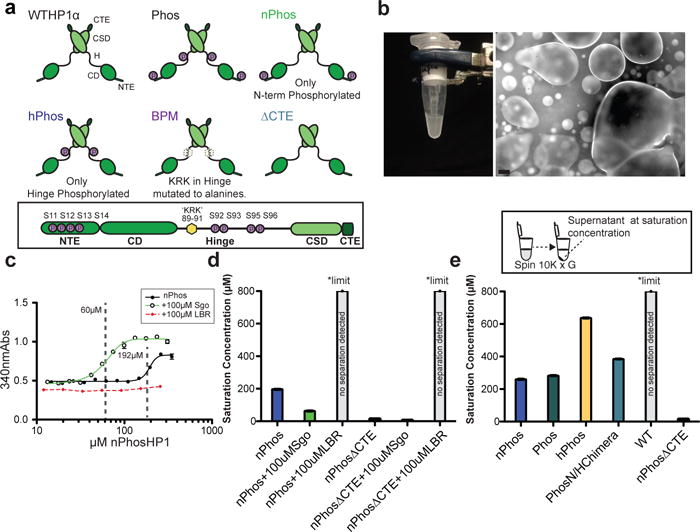
Phase separation by HP1α. a, Schematics of HP1α mutants. CTE-C-Terminal Extension, CSD-ChromoShadowDomain, H-Hinge, CD-ChromoDomain, NTE-N-Terminal Extension. b, Left panel: Phase separation of nPhos-HP1αat 4°C, 75 mM KCl, 20 mM HEPES pH 7.2. Right panel: Micrograph of phase separated nPhos-HP1α taken at 10×. Scale bar is 50 μm. c, Turbidity assay using a sigmoid function to measure saturation concentration. Dotted vertical lines indicate calculated saturation concentration. d, Saturation concentrations for nPhos-HP1α and nPhos-ΔCTE-HP1α with and without Sgo or LBR peptides. e, Saturation concentrations of different HP1α proteins using spin-down assay (inset). Measurements entailed three independent experiments (n=3), error bars reflect standard error of the mean (s.e.m).