
Extended Data Figure 3. Estimation of oligomeric potential by sedimentation velocity analytical ultracentrifugation.
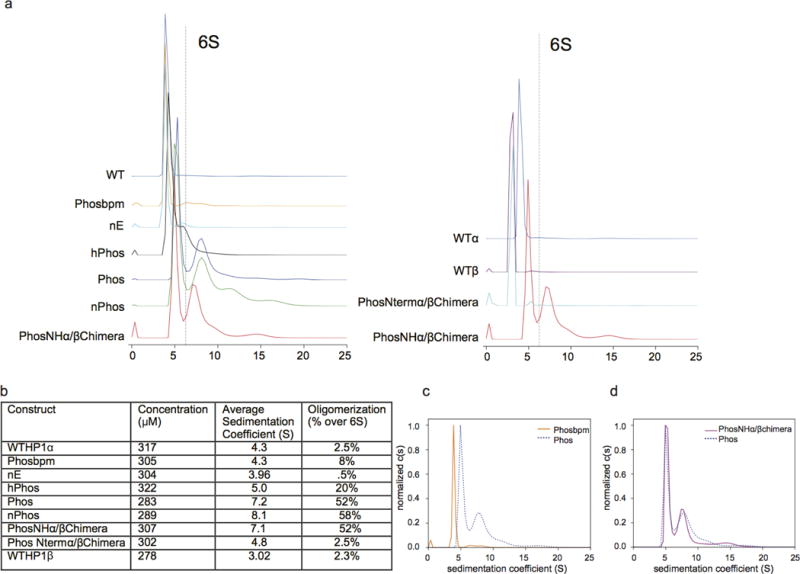
a, Representative sedimentation velocity runs from high concentration HP1 samples. Percentage of the loaded sample higher than 6S was quantified to estimate oligomeric species higher that a dimer. b, Table showing the comparison of high concentration AUC runs. Average sedimentation coefficient was quantified by integrating from 1–20S and higher order oligomers were estimated by integrating signal from 6–20S. c, Analytical ultracentrifugation c(S) analysis of fully phosphorylated HP1α and the fully phosphorylated basic patch mutant. d, Analytical centrifugation c(S) analysis of fully phosphorylated HP1α and the fully phosphorylated HP1α/β chimera (PhosNH-α/βchimera). Representative traces from three independent experiments are shown in a,b,c and d (n=3).