
Extended Data Figure 5. Scattering and Guinier fits of SAXS on WT and nPhos HP1α show homogeneous populations.
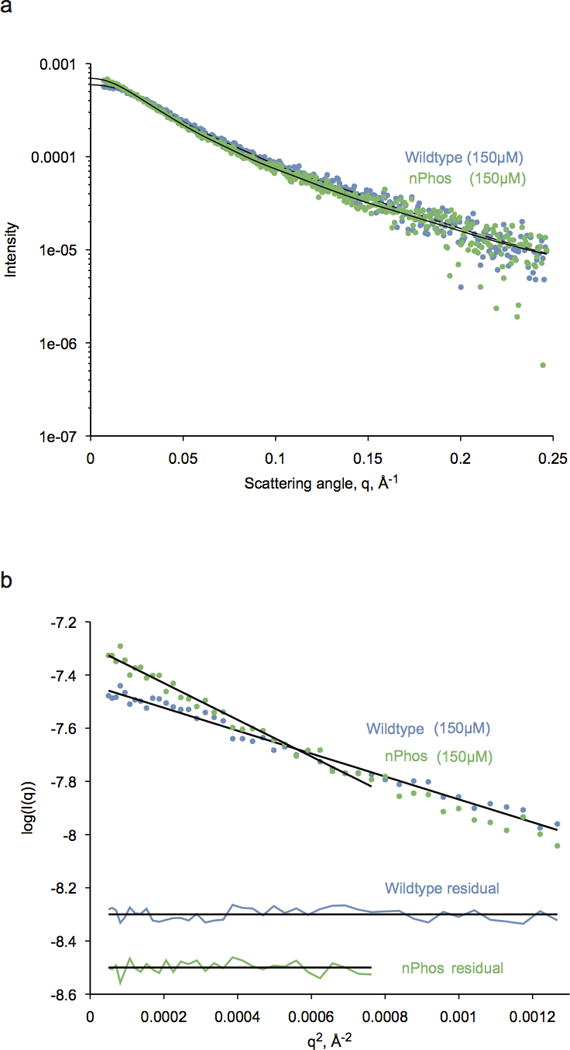
a, Raw X-ray scattering intensity of WT (blue points) and nPhos-HP1 (green points) at 3.5 mg/mL (150μM) concentration. Black lines are Fourier transforms of the fitted interatomic distance distribution, P(r), with chi-square values of 1.186 and 1.199 for WT and nPhos, respectively. b, Guinier plots of WT (blue points) and nPhos-HP1 (green points) at 150μM. Black lines are linear fits to the data plotted as log-intensity versus q2. The range of data used in the linear fits extend up to q*Rg of 1.3. The corresponding residuals for each fit are shown below as vertically-shifted horizontal lines for clarity.