
Extended Data Figure 8. Effects of additional ligands on saturation concentrations.
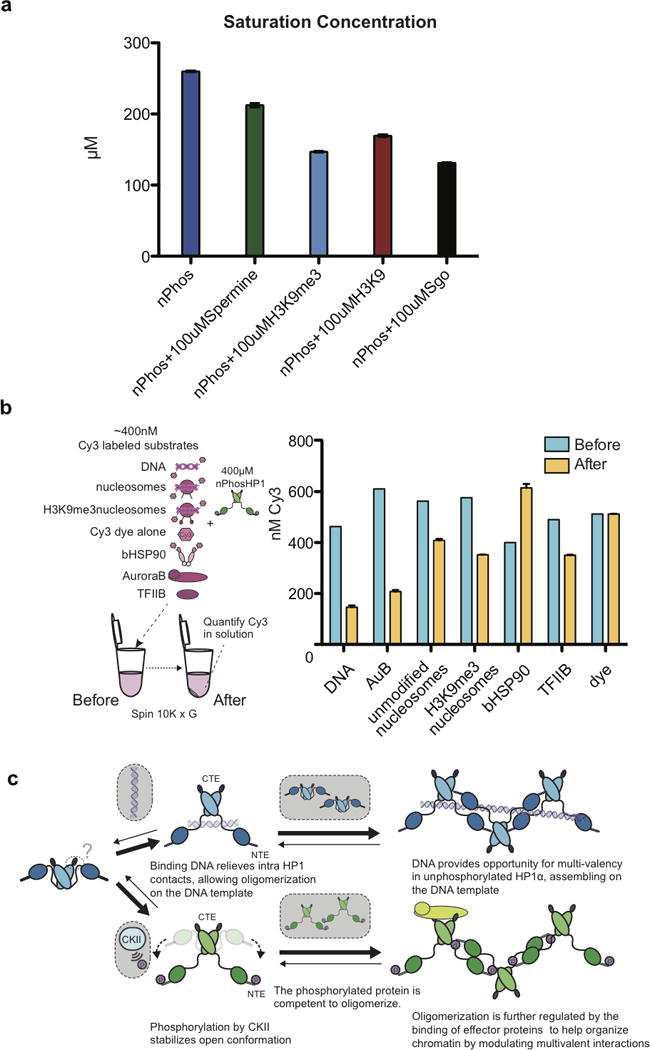
a, Bar graphs displaying the effects of 100 μM of the polyamine spermine along with the H3K9 and H3K9me3 peptides on phase separation behavior. b, Schematic of the assay used to quantify the partitioning of Cy3 labeled substrates into the two phases. The blue bars represent the total concentration of the labeled species before spin down; the orange bars represent the concentration of Cy3-labeled species remaining in the upper phase after spin down. The lower phase contains HP1α at a higher concentration than in the upper phase. Error bars represent standard error of the mean from three independent measurements. c, Model for phosphorylation or DNA driven HP1α phase separation. Phosphorylation or DNA binding relieves intra HP1 contacts and opens up the dimer. The location(s) of the intra- and inter-dimer contacts that change during this transition are not fully understood, but are predicted to involve interactions between the CTE, hinge, and NTE.