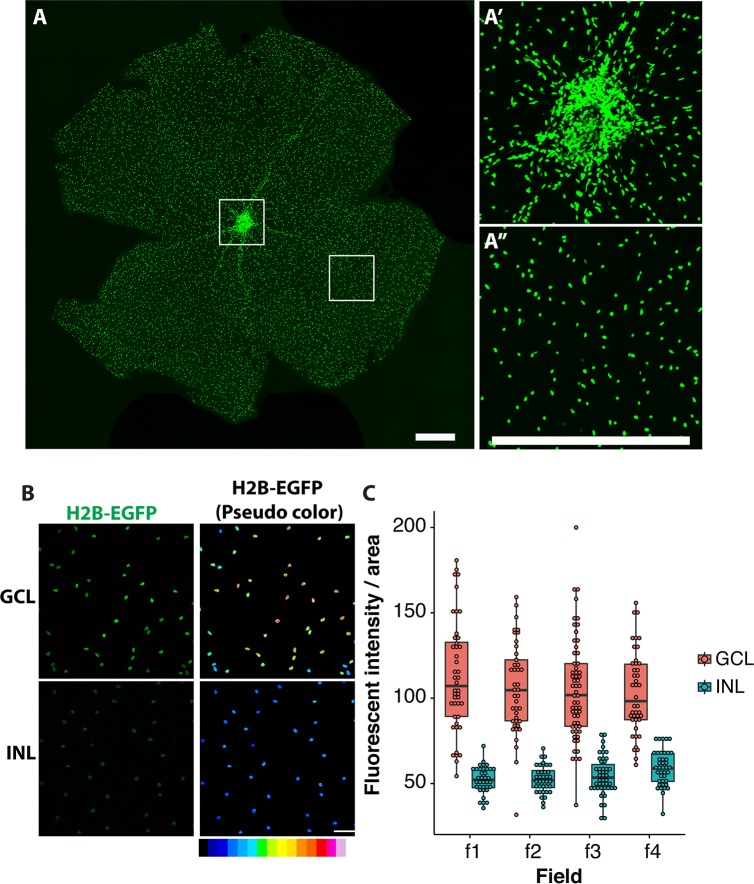
Figure 2.
Expression pattern of αGFP in the retina. (A–A”) Whole-mount retina from 1-month-old αGFP/+ mouse. Two boxed areas in (A) are shown at higher magnification at the right (A'–A”). (B, C) Relative intensity of EGFP fluorescence in the GCL and INL. Right images in (B) were pseudo-colored for better demonstration of differences in the intensity of fluorescence in the GCL and INL. Four fields were counted for each layer. Scale bars: 500 μm (A–A”); 50 μm (B).

