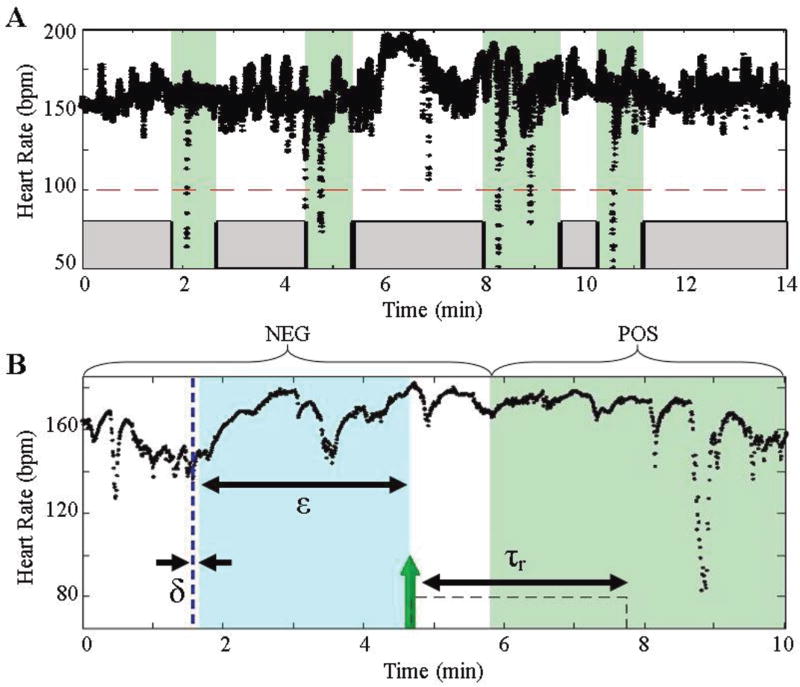
Fig. 2.
(a) The green areas denote regions that encompass a bradycardia. Notice that secondary bradycardias (8–9 min) are classified as one event. The other regions (gray) represent regions absent bradycardia. (b) Detailed diagram of one particular bradycardia segment. The parameters used for the algorithm are outlined in the Table 2. A prediction is triggered with a time stamp of the leading edge of the evaluation window (green arrow).

