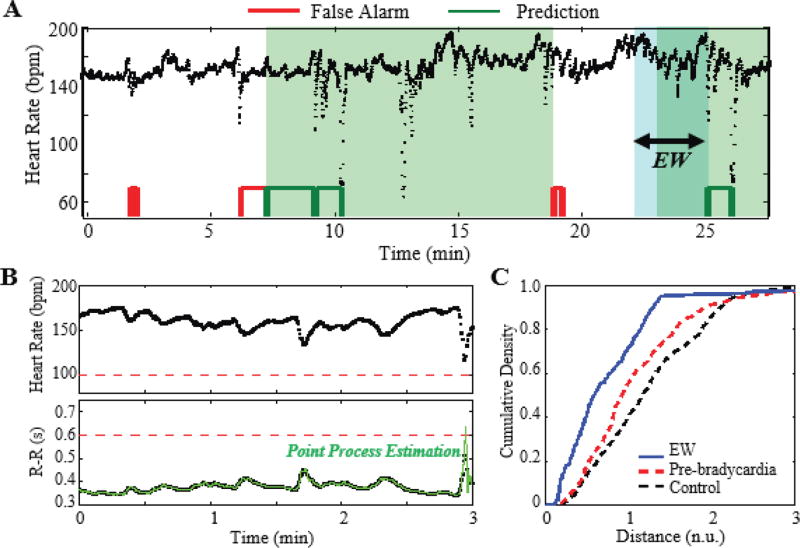
Fig. 4.
(a) Prediction outcome for Infant 7 (ε = 3 min, δ = 5 s, τr = δ). The instantaneous M(t) and V(t) indices from the evaluation window (EW, blue region) are calculated and used to predict bradycardia. The red and green blocks (bottom) denote false and positive predictions, respectively, at a FPR of 0.15. (b) The heart rate and inter-beat interval data are depicted as black, and the point process estimation is depicted as green. (c) A cumulative density curve for the evaluation window (blue curve) is compared to the training models. In this instance, the evaluation curve satisfies a threshold to trigger a prediction.

