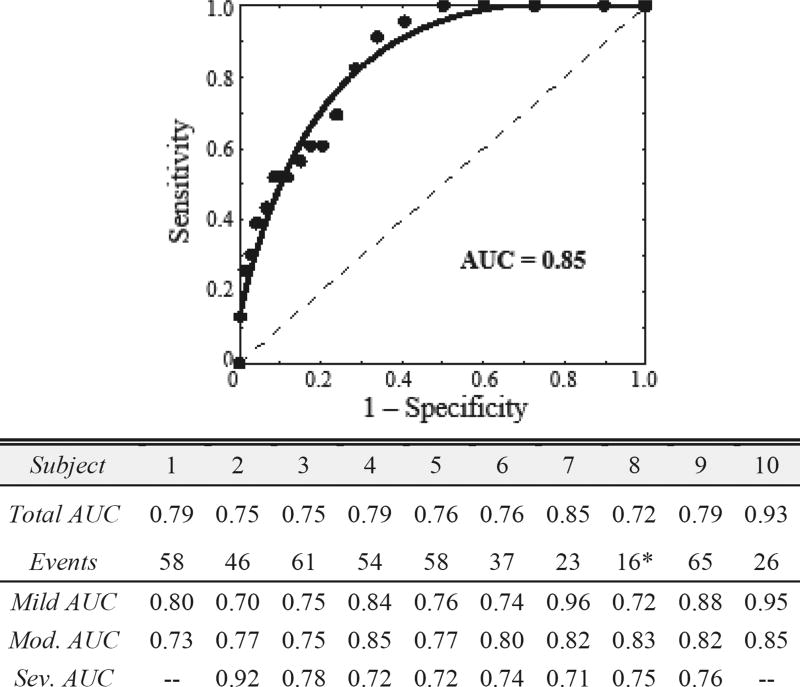
Fig. 5.
ROC curve for infant 7. The dashed line represents an algorithm preforming by chance (AUC of 0.5). We observe a mean AUC of 0.79±0.018 for 444 bradycardia events. The severity performance is also given. Note “—“ denotes no events. *Infant 8 exhibited frequent single skipped-beat episodes that led to instantaneous bradycardia.

