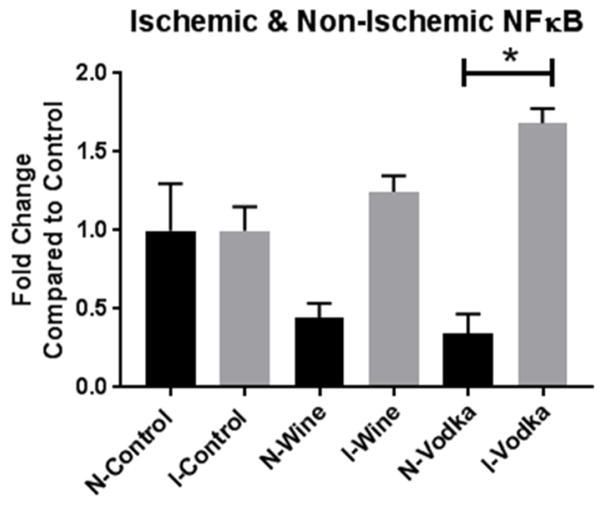
Figure 2. Ischemic versus Non-Ischemic NFκB.
Bar diagrams show NFκB expression levels as fold-change values +/− standard error of the mean compared to control samples. All samples were normalized to GAPDH prior to analysis. Control – hypercholesterolemic diet alone (n=8), Wine = hypercholesterolemic diet with wine (n=8), Vodka = hypercholesterolemic diet with vodka (n=8); * = p<0.05 by Kruskal Wallis ANOVA and a Dunn’s post-hoc test.

