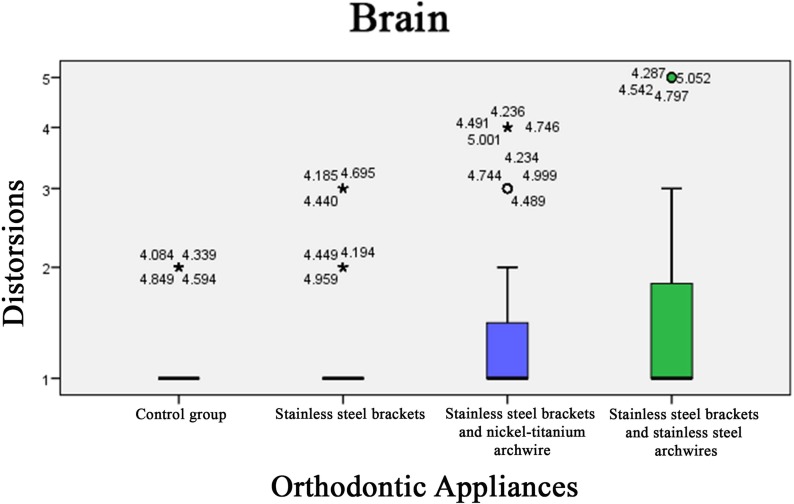
Figure 2.
Box-and-whisker plots related to the distortion scores in the four groups according to orthodontics appliance in the brain region. The dark line in the middle of the boxes is the median. The box represents the interquartile (IQ) range which contains the middle 50% of the records. The whiskers are lines that extend from the upper and lower edges of the box to the highest and lowest values which are no greater than 1.5 times the IQ range. The circles are outliers. These are defined as values that do not fall within the whiskers. The asterisks or stars are extreme outliers. These represent cases that have values more than three times the height of the boxes.

