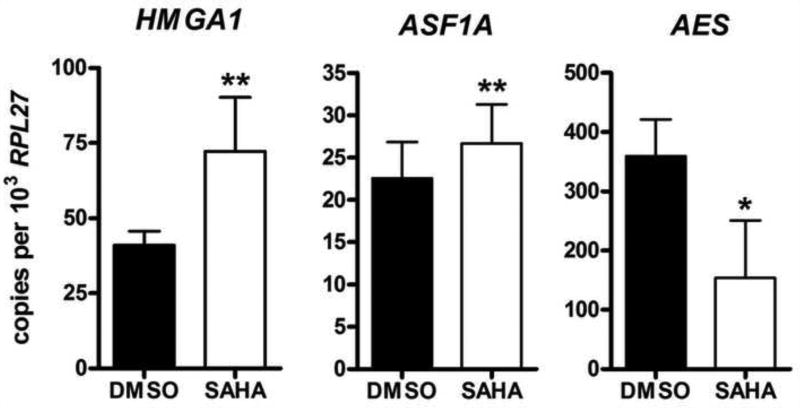
Figure 5. Validation of gene expression by droplet digital PCR (ddPCR).
Number of molecules of each target mRNA was normalized to the number of molecules of the normalizer mRNA (RPL27) in one nanogram of total RNA (expressed as copies per thousand RPL27 molecules). Normality of the distribution and equality of variance in the DMSO and SAHA treated groups were assessed in the R computing environment, and either t-test (HMGA1 and ASF1A) or Wilcoxon signed rank test (AES) were performed to assess the difference of expression induced by SAHA. The experiment was performed with cells from 6 independent donors. Error bars represent standard deviation. **, p<0.01; *, 0.01<p<0.05.

