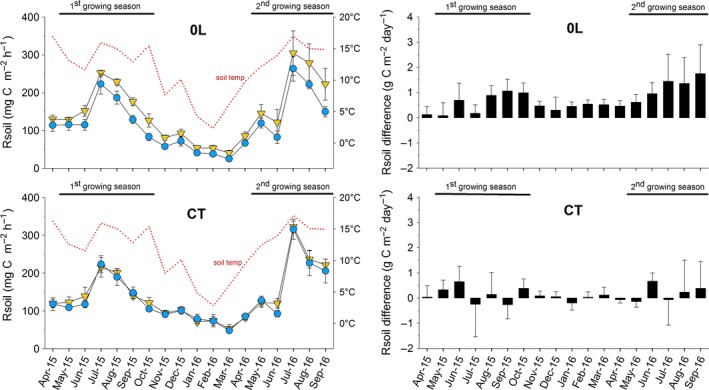
Figure 4.

Soil respiration (Rsoil, left‐hand panels) measured monthly in subplots with daily applications of root exudate solution (RE, yellow triangles) or a procedural control solution (CP, blue circles); and barplots showing the significant increase in Rsoil in RE compared to CP subplots (right‐hand panels) within litter removal plots (0L) but not control plots (CT); means ± SE are given for n = 5. The Automated Root Exudate System (ARES) treatment periods corresponding to the main growing seasons in 2015 and 2016 are indicated with black horizontal lines; the dotted red line (left) indicates the mean soil temperature at 0–10 cm depth.
