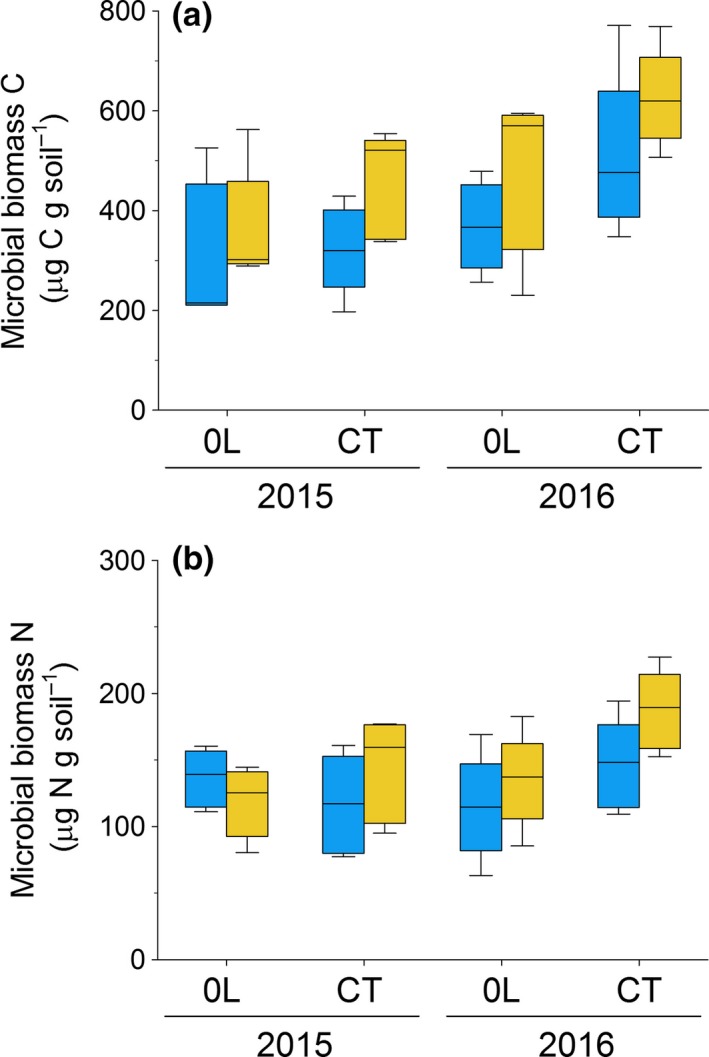
Figure 5.

(a) Soil microbial biomass carbon (C) and (b) soil microbial biomass nitrogen (N) at the end of the growing season (September 2015 and 2016) in subplots with daily applications of root exudate solution (yellow boxplots) or a procedural control solution (blue boxplots) within litter removal (0L) and control plots (CT); the boxes indicate medians and upper and lower quartiles, whereas whiskers indicate 90% minimum and maximum values for n = 5.
