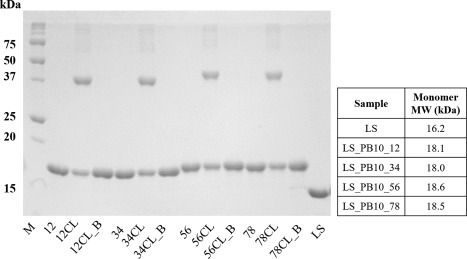
Figure 2.

Reducing SDS‐PAGE (12%) analysis of LS and LS_PB10 capsid constructs. Two micrograms of protein were loaded in each lane. M, (molecular ladder); 12, (LS_PB10_12); 12CL, (LS_PB10_12 CL no boiling); 12CL_B, (LS_PB10_12 CL 30 min boiling); 34, (LS_PB10_34); 34CL, (LS_PB10_34 CL no boiling); 34CL_B, (LS_PB10_34 CL 30 min boiling); 56, (LS_PB10_56); 56CL, (LS_PB10_56 CL no boiling); 56CL_B, (LS_PB10_56 CL 30 min boiling); 78, (LS_PB10_78); 78CL, (LS_PB10_78 CL no boiling); 78CL_B, (LS_PB10_78 CL 30 min boiling); LS (LS no boiling). See Figure 1 for description of samples. For boiling treatment, samples were mixed with sample buffer and boiled for 30 min before sample loading, while other samples were kept at room temperature in presence of sample buffer for 30 min. Two microgram of protein was loaded in each lane. The theoretical molecular weights of the monomer for each construct are listed in the table
