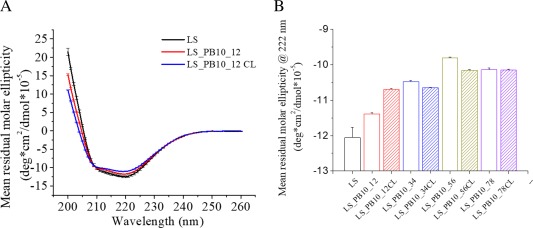
Figure 4.

Comparison of the secondary structure of LS and LS_PB10 constructs in PBS buffer at 25 °C (A) Circular dichroism spectra of LS, LS_PB10_12 and LS_PB10_12CL samples; (B) Comparison of the mean residual molar ellipticity at 222 nm for LS and LS_PB10 constructs. Error bars are standard deviations (N = 3). See Figure 1 for sample composition
