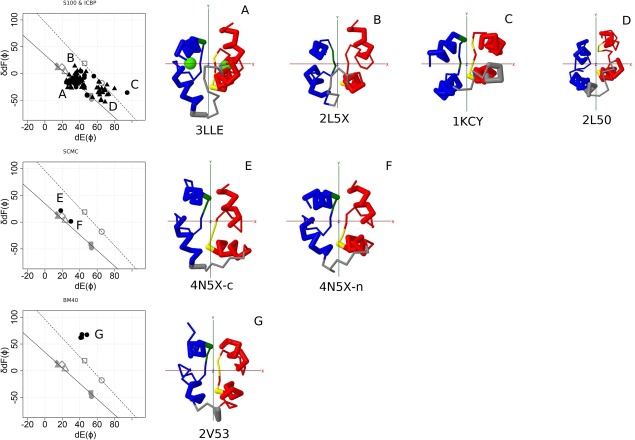
Figure 4.

Structures of S100&ICBP, SCMC, and BM40. Left panel, Conformational maps of EF‐lobes. Top, S100&ICBP. Subfamily ICBP (filled circle), subfamily S100 (filled triangle). Middle, SCMC. Subfamily SCMC (filled circle). Bottom, BM40. Subfamily BM40 (filled circle). The positions A, B, C, and D of CTER are shown in the following plot using symbols with gray. Right panel, Structures of each group. A, Calcium bound S100B (S100); B, calcium bound S100A13 with target (S100); C, calcium free calbindin D9k (ICBP); D, calcium free S100A16 (S100); E, C‐lobe of calcium bound SCMC; N‐lobe of calcium bound SCMC; G, Calcium bound BM40. red, odd (N‐terminal) EF‐hand; blue, even (C‐terminal) EF‐hand; gray, linker connecting two EF‐hands; green sphere, calcium. For details, see the legend for Figure 2.
