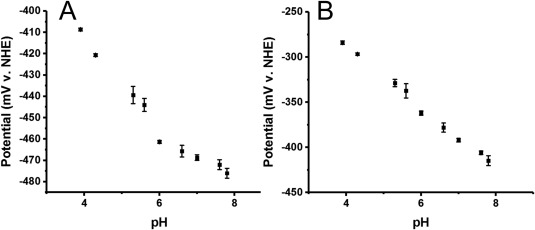
Figure 2.

pH Titration of Flavodoxin II. (A) Dependence of the midpoint potential of the lower potential redox species (semiquinone/hydroquinone potential E 1) on the solution pH. Each data point is the average of three separate experiments, with the standard error of the mean indicated. The slope of the linear portion of this curve at low pH is 23 mV/pH unit. (B) Dependence of the midpoint potential of the higher potential redox species (quinone/semiquinone couple E 2) on the solution pH. Each data point is the average of three separate experiments, with the standard error of the mean indicated. The slope of the linear portion of this curve was 34 mV/pH unit.
