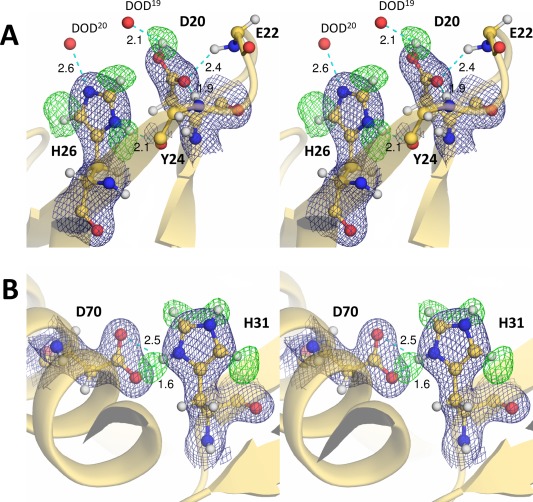
Figure 2.

Nuclear‐density maps for the histidine and adjacent acidic residues. Each residue is represented as a ball‐and‐stick model. The 2F o – F c electron‐density maps (contoured at 1.5 σ) for the respective residues and their F o – F c deuterium (D)‐omit nuclear‐density maps (contoured at 3.2 σ) are shown as deep blue and green meshes, respectively. Hydrogen bonds are shown by cyan dashed lines, with distances in Å. (A) The carboxyl Dδ2 atom of Asp20 and the imidazole deuterium atoms of His26 were omitted from the Fourier synthesis calculation. (B) Only the imidazole deuterium atoms of His31 were omitted from the Fourier synthesis calculation. The doubly protonated imidazole ring of His31 forms a salt bridge with the deprotonated carboxylate group of Asp70.
