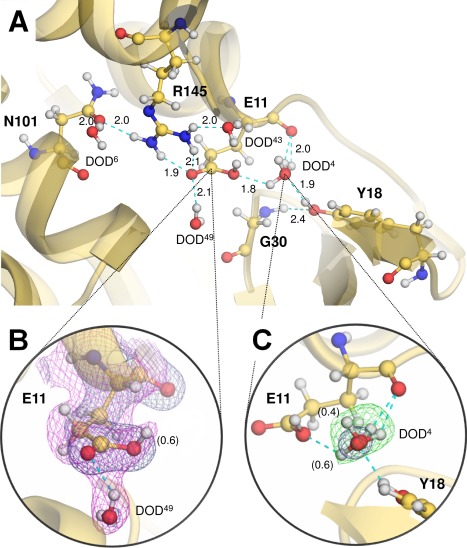
Figure 4.

Protonation states of the active site residues. (A) Ball‐and‐stick representation of the active site residues. Hydrogen bonds are shown by cyan dashed lines, with distances in Å. (B) Nuclear‐density map for the catalytic Glu11 residue. The 2F o – F c electron‐density maps (deep blue) for Glu11 and a surrounding water molecule (DOD49) are contoured at 1.5 σ. The sigma‐A 2F o – F c nuclear‐density map (magenta) contoured at 1.0 σ suggests the protonated form of Glu11, in which its crystallographic occupancy was estimated to be 0.6. (C) Nuclear‐density map for DOD4 interacting with Glu11. The 2F o – F c electron‐density map (deep blue) for a heavy water (DOD4) interacting with Glu11 is contoured at 1.5 σ, and the F o – F c D‐omit nuclear‐density map (green) is contoured at 3.2 σ. This water‐binding site was assigned as a mixed state with two different orientations. Their relative occupancies are indicated in parentheses.
