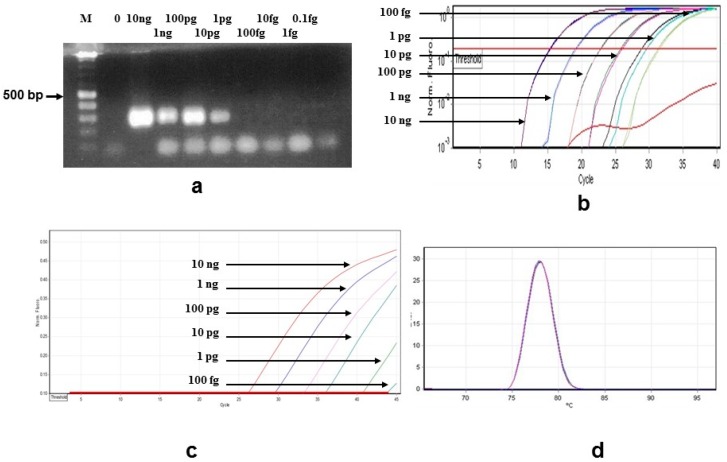
Figure 2.
Results obtained from all B. bigemina PCR assays examined in this study: (a) Sensitivity of the standard PCR assay determined following agarose gel electrophoresis. M is the Bioline HyperLadder II and the concentrations of B. bigemina DNA are shown above each lane with PCR products estimated at 278 bp; (b) SYBR Green qPCR plots of B. bigemina dilutions with DNA concentrations indicated; (c) TaqMan qPCR plots of B. bigemina dilutions with DNA concentrations indicated; (d) Melting curves from the SYBR Green qPCRs in Figure 2b.

