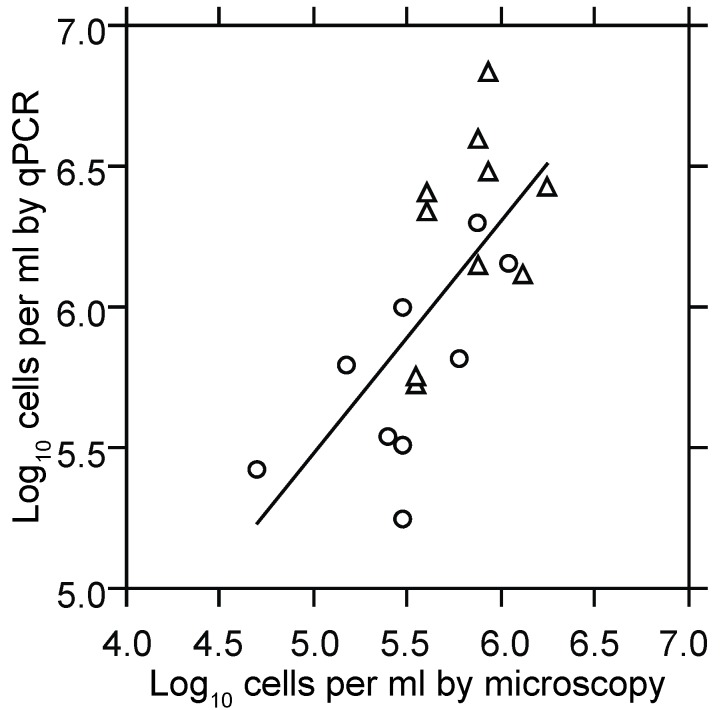
Figure 2.
Scatter plot with linear regression of log-transformed counts of B. hermsii cells in plasma by phase microscopy and counting chamber (x-axis) and quantitative PCR (qPCR; y-axis). Circles and triangles denote samples of blood taken at hours 94.5 or 102 from immunocompetent BALB/c mice infected at hour 0, as described in the text. The slope (95% confidence interval) for the least-squares regression was 0.85 (0.4–1.3), and the combined R2 was 0.46 (p < 0.001).

