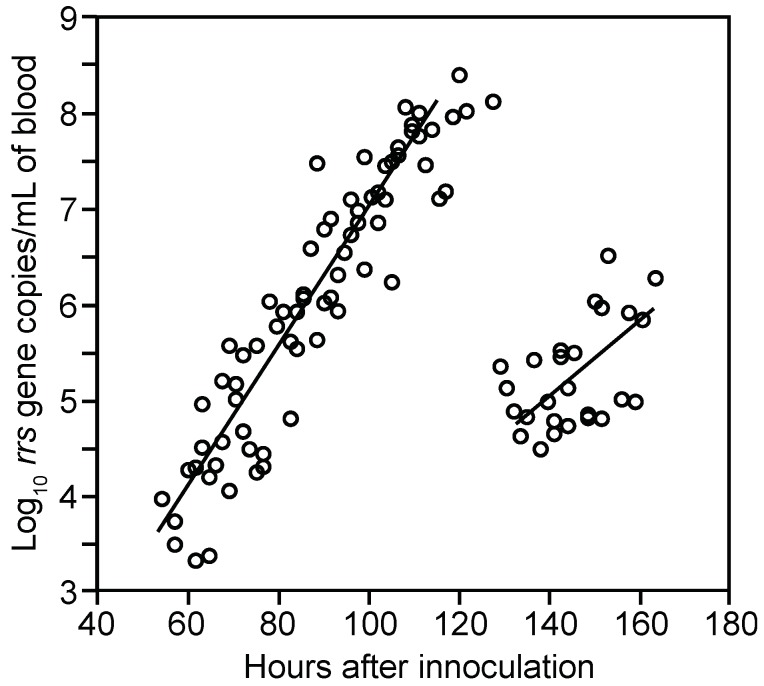
Figure 3.
Proliferation and decline of B. hermsii HS1 cells in the blood of infected immunocompetent mice over time. The graph is a scatter plot of collected data on gene copies of 16S ribosomal RNA (rrs) of B. hermsii by qPCR (y-axis) against time in hours (x-axis) after inoculation of 95 BALB/c mice with serotype 7 of strain HS1. Samples were collected every 3 h beginning 12 h after inoculation; second samples were obtained from each mouse 7.5 h after the first. Each data point is a sampling from a single mouse. Linear regression determinations were made separately for hours 50–120 (R2 = 0.86) and >120.

